 |
A Global Model of the Light Curves and Expansion Velocities of Type II-Plateau Supernovae
O. Pejcha1 and J. L. Prieto2
1 Hubble and Lyman Spitzer Jr. Fellow, Department of Astrophysical Sciences, Princeton, NJ, USA
2 Nucleo de Astronomia de la Facultad de Ingenieria, Universidad Diego
Portales & Millennium Institute of Astrophysics, Santiago, Chile
Email: pejcha_[at]_astro_[dot]_princeton_[dot]_edu
|
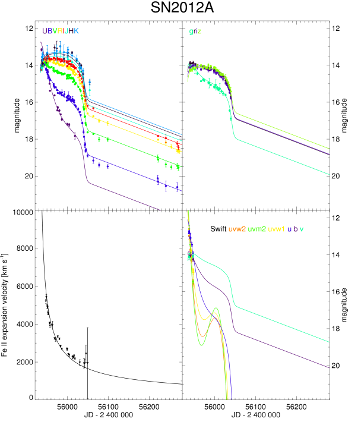
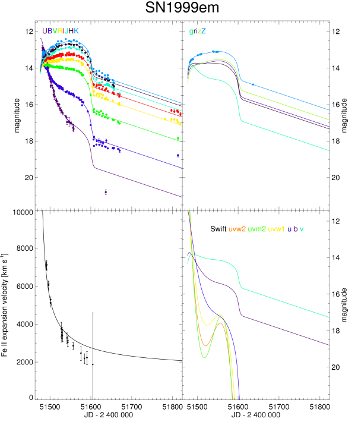
We present a new self-consistent and versatile method that derives photospheric radius and temperature variations of Type II-Plateau supernovae based on their expansion velocities and photometric measurements. We apply the method to a sample of 26 well-observed, nearby supernovae with published light curves and velocities. We simultaneously fit ~230 velocity and ~6800 magnitude measurements distributed over 21 photometric passbands spanning wavelengths from 0.19 to 2.2 μm. The light curve differences among the Type II-Plateau supernovae are well-modeled by assuming different rates of photospheric radius expansion, which we explain as different density profiles of the ejecta and we argue that steeper density profiles result in flatter plateaus, if everything else remains unchanged. The steep luminosity decline of Type II-Linear supernovae is due to fast evolution of the photospheric temperature, which we verify with a successful fit of SN1980K. Eliminating the need for theoretical supernova atmosphere models, we obtain self-consistent relative distances, reddenings, and nickel masses fully accounting for all internal model uncertainties and covariances. We use our global fit to estimate the time evolution of any missing band tailored specifically for each supernova and we construct spectral energy distributions and bolometric light curves. We produce bolometric corrections for all filter combinations in our sample. We compare our model to the theoretical dilution factors and find good agreement for the B and V filters. Our results differ from the theory when the I, J, H, or K bands are included. We investigate the reddening law towards our supernovae and find reasonable agreement with standard RV ~ 3.1 reddening law in UBVRI bands. Results for other bands are inconclusive. We make our fitting code publicly available.
Update Feb 23 2016: physical parameters of supernovae from our followup paper are available
Update Nov 25 2014: the paper has been accepted for publication
Update Nov 17 2014: the current version of the code now uses the same priors on supernova parameters as in our paper. GSL and GSLCBLAS are required for this functionality (eigenvectors & eigenvalues)
Light curve fits
SN1980K,
SN1992am,
SN1992H,
SN1995ad,
SN1996W,
SN1999em,
SN1999gi,
SN2001dc,
SN2002hh,
SN2004A,
SN2004dj,
SN2004et,
SN2005cs,
SN2006bp,
SN2006my,
SN2007od,
SN2008bk,
SN2009bw,
SN2009dd,
SN2009js,
SN2009md,
SN2009N,
SN2010aj,
SN2012A,
SN2012aw
Bolometric corrections
We give a table of fits to bolometric correction for band j, BCj = Mbol - Mj, as a function of color index mi - mj. The table columns are the color index name (e.g. B-V), range of color index mi - mj, where the fit is valid, coefficients c0, c1, c2, c3, and c4 of the fitting equation BCj = Σk=0...4 ck (mi - mj)k. The last column is the standard deviation about the fit σ, which measures only the goodness of fit and not how accurately is BCj obtained from the data.
Code description
The fitting code can be downloaded here. The code is a minimally stripped down version of considerably more complex code and a lot of bells and whistles not interfering with the current functionality were not removed. Please beware when tinkering around, especially for segmenation faults resulting from array allocation and access. The code was tested under Linux and Cygwin, but is certainly not error-free.
The code reads in data of a single supernova, fits it with the model of our paper (using the global parameters from the paper) and returns the parameter values, their uncertainties (including modified fit with χ2/NDOF=1) and model fits. Two test datasets of SN2004et and SN2009N are supplied compiled from the work of Maguire et al. (2010), Pritchard et al. (2014), and Takats et al. (2014). Note that the fit results for these supernovae are slightly different from what was reported in our paper. The reason are the missing priors, and in case of SN2004et in NGC6946 we are obtaining the host galaxy distance only from one supernova and not three (SN2002hh and SN1980K in addition).
Installation
The code was successfully compiled and executed under Linux, Cygwin, and Mac.
Go to directory cmpfit-1.2 and type make. This compiles the fitting routine CMPFIT, which has been modified to handle a large covariance matrix and reports χ2 in every iteration.
Now go back to the original directory and look in Makefile. If you are under Cygwin, change LDFLAGS_CYGWIN to LDFLAGS. This increases the stack size, but the requisite compiler command is not recognized under Linux. Now execute make fit_single, which should compile the code (with a bunch of warnings).
Input
When you successfuly compile the code, then it should be set up so that you get results just by running ./fit_single.exe SN2004et.dat or ./fit_single.exe SN2009N.dat. The source code is only minimally documented, but proceeds along the general lines of reading in the data, initializing fit coefficients, choosing which variables to fit, and exporting the results. There are comments on how to impose limits on parameters or fix their values. This is important for explosion times and distances.
The columns in the data input file are
ref dset flt jd val err
where ref is the label for data reference (the code can in principle handle blocking individual data sources, photometric bands and individual data points, but most of the functionality is disabled in the public version), dset is 0 for expansion velocity and 1 for photometry, flt is the label of photometric band explained below or the line used to obtain expansion velocity (0 for Fe II 5169), val and err are the value and uncertainty of the measurement.
The filter labels are:
U	0
B	1
V	2
R	3
I	4
J	5
H	6
K	7
g	9	#SDSS DR7 SDSS = AB - 0.02
r	10	#SDSS DR7 SDSS = AB - 0.02
i	11	#SDSS DR7 SDSS = AB - 0.02
z	12	#SDSS DR7 SDSS = AB - 0.02
uvw2	13	#Swift uvw2 @ 1928A
uvm2	14	#Swift uvm2 @ 2246A
uvw1	15	#Swift uvw1 @ 2600A
u	16	#Swift u    @ 3465A
b	17	#Swift b    @ 4392A
v	18	#Swift v    @ 5468A
Z	19	# Hamuy et al. (2001) - on 1999em
Y	20	# in the YJHK series?
Do not use filter numbers not listed here - these are placeholders for other filters, where we weren't able to obtain enough data to constrain global parameters. Using such bands will make the fits wrong.
Output
The code prints to terminal parameter values and their uncertainties (both default and with χ2/DOF set to unity) and also nickel mass and bolometric luminosity at 50 days after the explosion. Note that the parameter values can be different from what we give in the paper, because this is a simpler version of the code without priors or simultaneous fitting of multiple supernovae.
The output file phot.dat outputs the photometric measurements and model parameters at each point. The columns are
JD mag mag_err filter star_no dy Pi tau 1-w
where star_no should be always equal to 0, dy is the relative difference between data and the model (data-model)/sigma, Pi is the dimensionless radius, tau is the temperature parameter, and 1-w is the weight function.
The output file velo.dat is the same but for velocities and the columns are
JD mag mag_err filter star_no dy Pi 1-w
The output file model_phot.dat has the results of the model on a uniform temporal grid with each column corresponding to a different passband explained in the file header. See filter codes above.
The output file model_velo.dat is the model predictions for velocity.
The output file lbol_err.dat has the bolometric luminosity as a function of time calculated according to our paper. The first column is JD, second column is bolometric luminosity in solar luminosities, third column is the uncertainty from the covariance matrix of the fitted supernova parameters, fourth column is the uncertainty from the covariance matrix of the global parameters obtained in the full fit of our model, and fifth column has these two uncertainties added in quadrature.
Notes
- There are some comments in fit_single.cpp on how to handle initial parameter values and the allowed range of their variations. Especially important are limits on the explosion time (or distance) in the case of supernovae with few data.
- If it the code doesn't work in the way you'd like to, please contact us, we'd be happy to help.